One map of your app,
from the screen to the column.
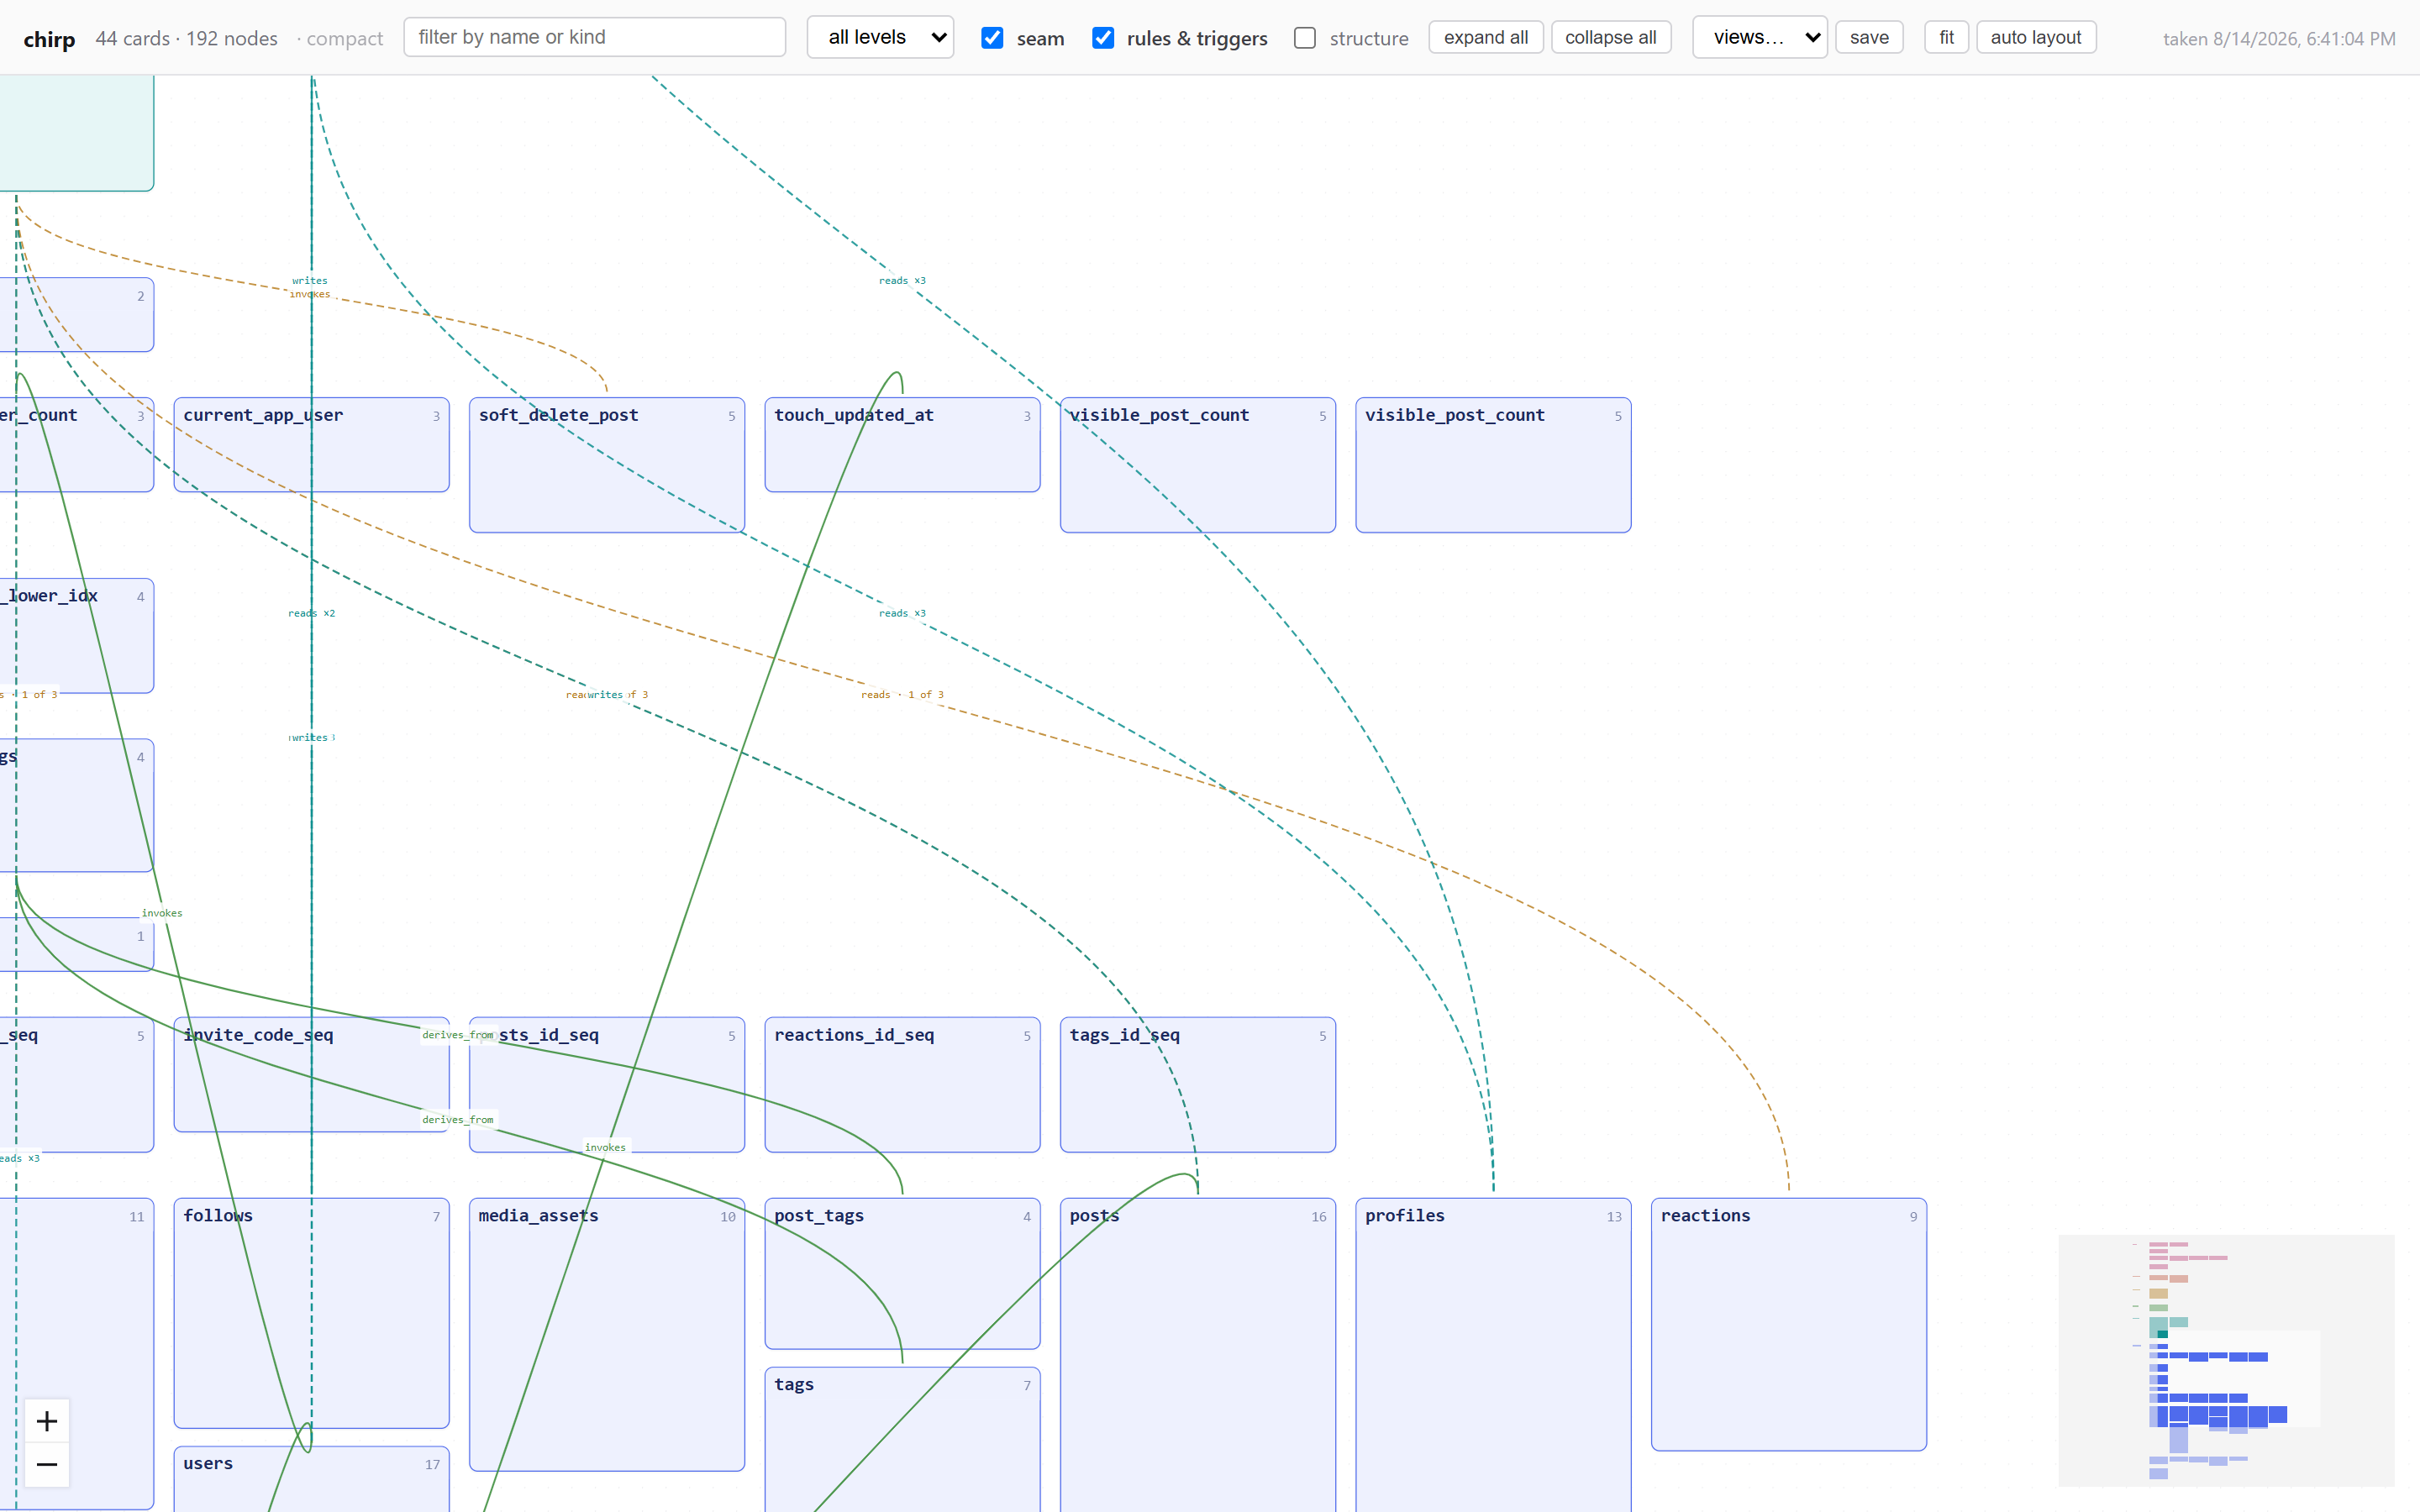
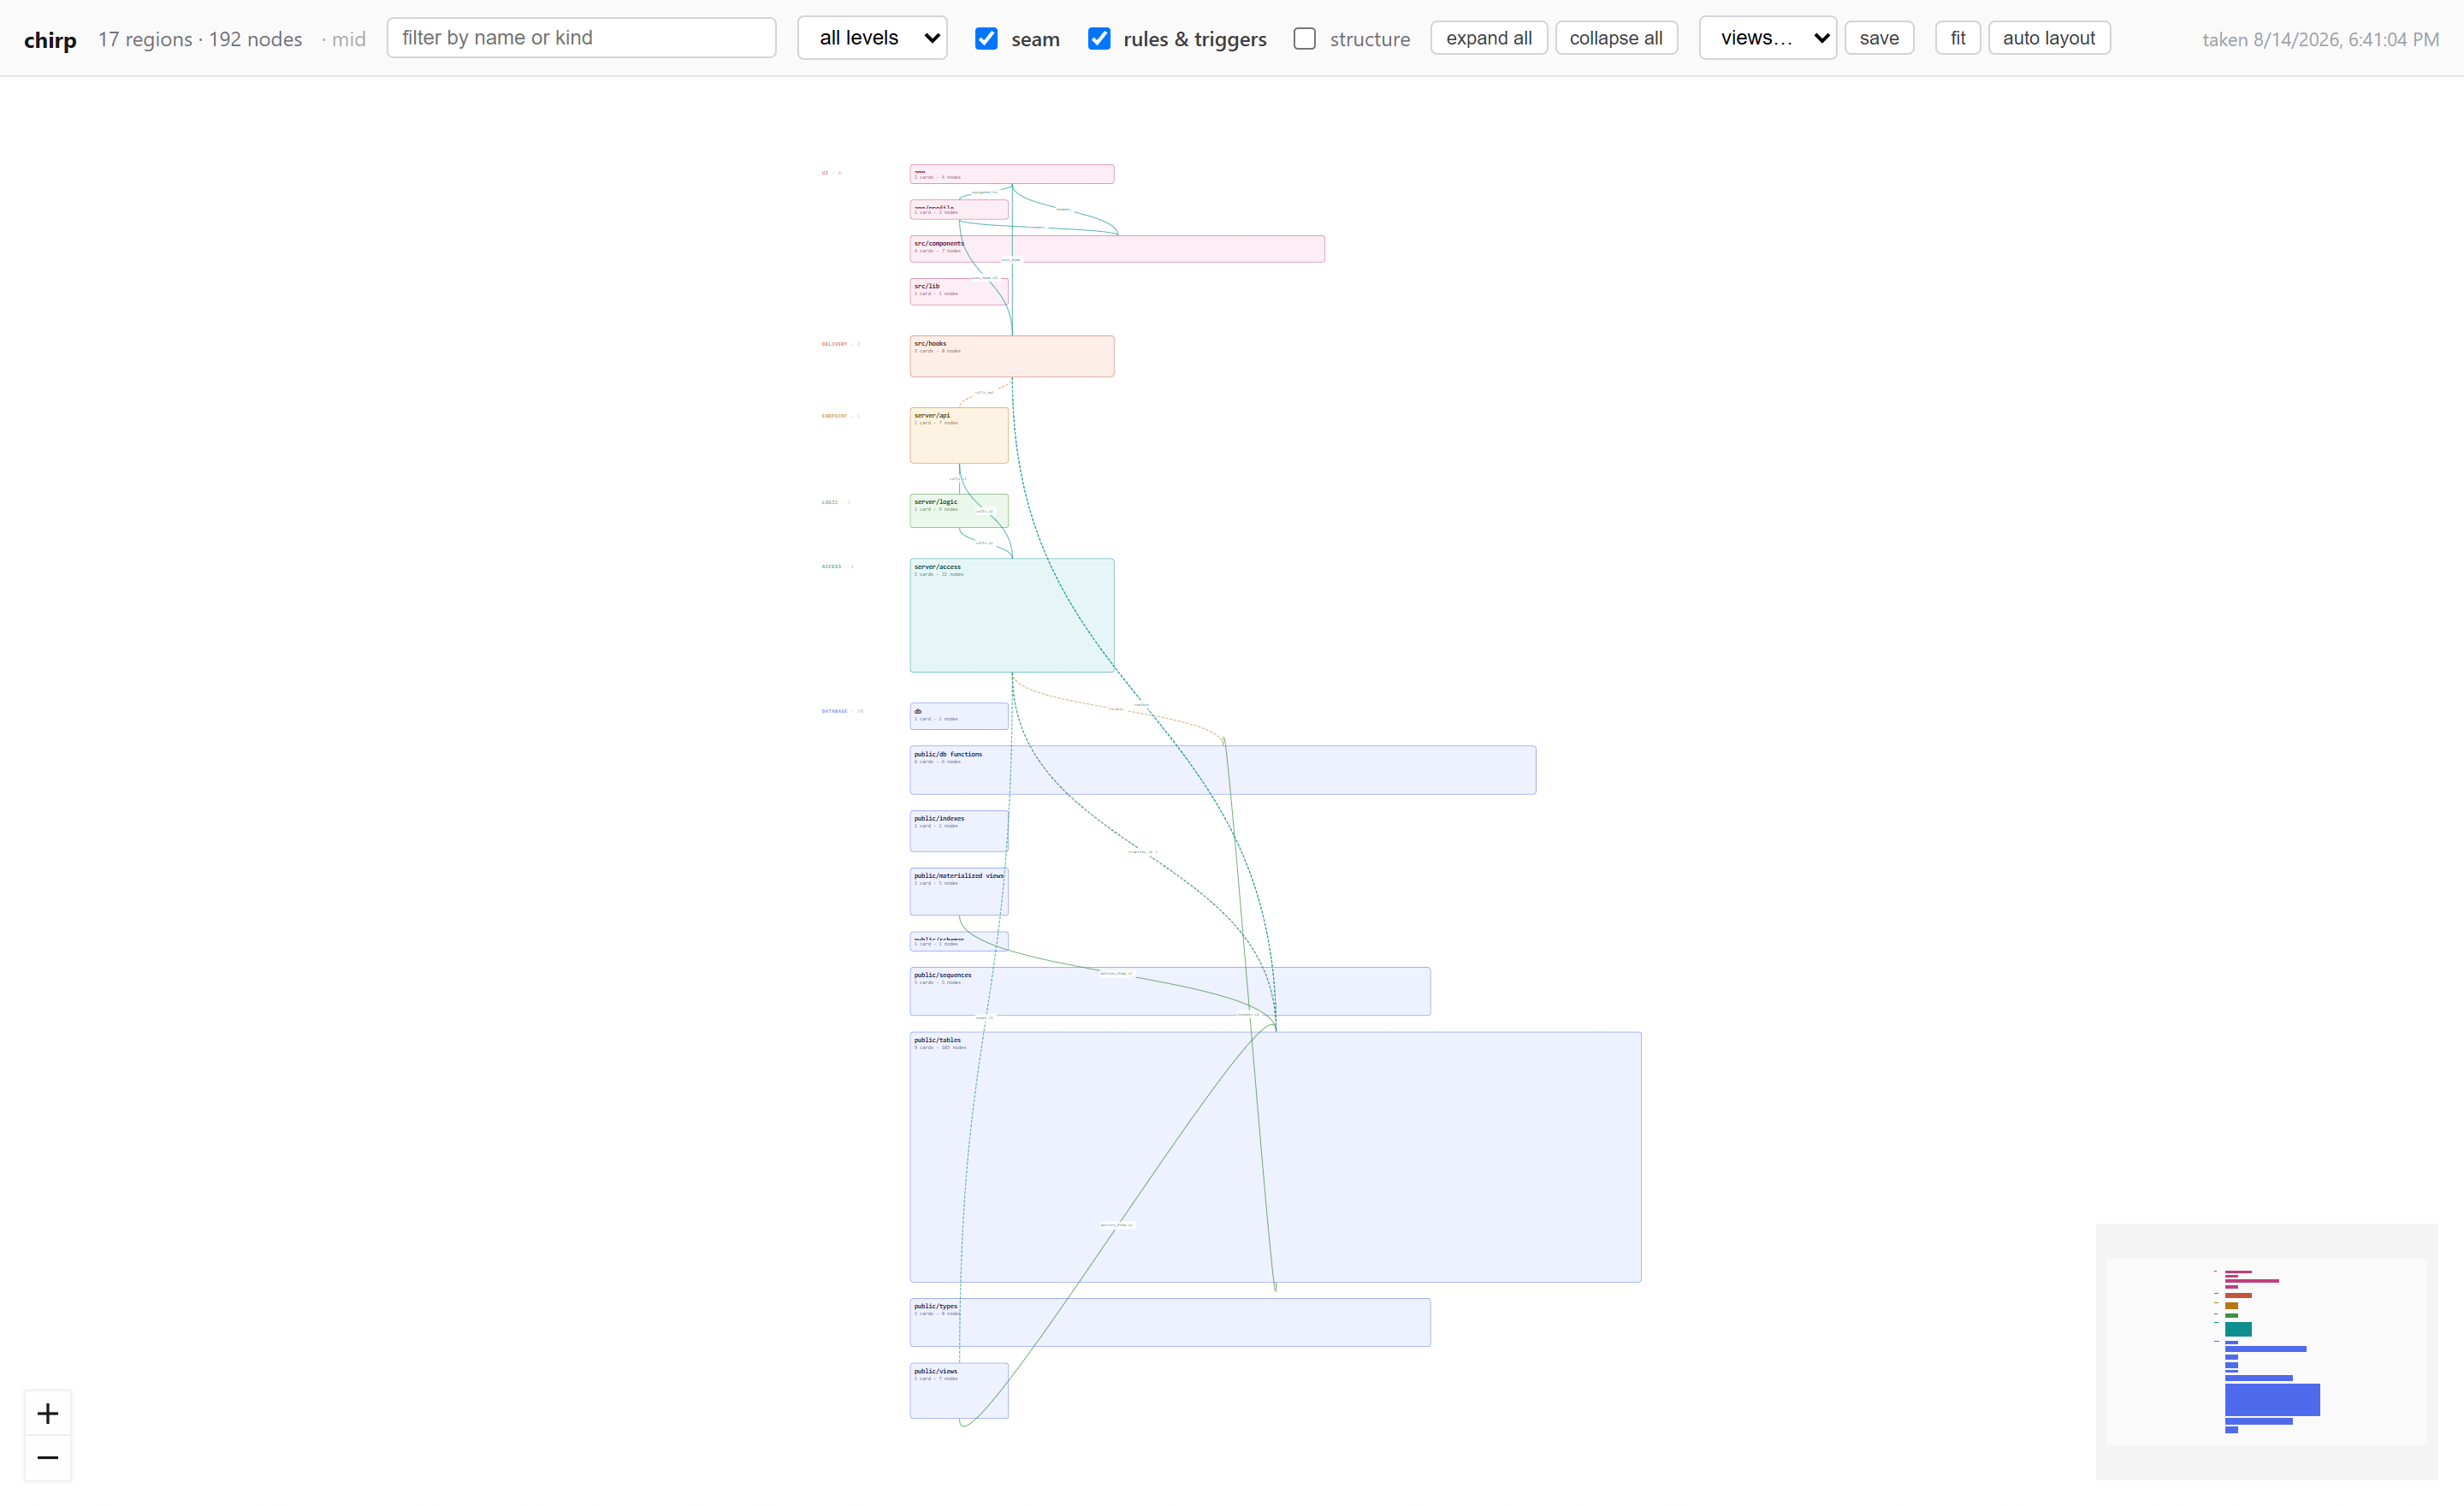
Tomograph reads your real source and your real database, then draws what connects to what: every screen, hook, endpoint, table, policy and trigger, in one picture. Because it is read rather than drawn, it cannot go stale.
The problem
Two questions, and no reliable way to answer either.
“If I change this, what breaks?”
“Where does this thing on the screen actually come from?”
Today the only way to answer is to read the code and hold it in your head. That works while the app is small and you wrote all of it. It stops working when it gets big, and it never survives handing the project to someone else, or coming back to it yourself in six months.
Why nothing does this
Every tool owns one horizontal layer, and is blind to its neighbours.
Schema tools see the database. Component catalogues see the front end. Service catalogues sit somewhere in the middle. Each is good at its own band and stops dead at the edge of it. Not one of them knows your access policies exist.
Tomograph is the vertical seam. Click a table and see the policies that gate it, the functions that write it, the endpoints that expose it, and the screens that render its data. Then click any one of those and travel back the other way.
What that buys you
A map is only worth having if it answers questions with consequences.
Know what a migration breaks
Drop a column and see, before you merge, every screen that still renders it. The graph is diffable, so the answer arrives as a pull-request check rather than an incident.
See which data is actually gated
Row-level policies mapped to the endpoints and screens that reach them, including the tables reachable with no policy at all. No other tool reads them.
Told what it is guessing
Read from the database is certain. Inferred from code is not, and says so. Where a table name is only known at runtime, it draws nothing and tells you why. A wrong edge is worse than a missing one.
Local first
It reads your whole codebase. Nothing leaves your machine.
The collectors run on your hardware and the server binds to 127.0.0.1. Your source is never uploaded, and your database connection never leaves the process that opened it.
That is an architectural decision rather than a pricing one. A tool that needs your credentials and your source in someone else’s cloud has to be trusted before it can be useful, and we would rather not ask.
It is also read-only. It looks; it never writes. No migrations, no edits, no drawing on the canvas. The picture changes because the source changed.
How it works
Three commands, and no configuration you have to invent.
- 01point it at a codebase
tomograph scan .Point it at a codebase
It walks the tree, works out which folders hold which level, and writes a config you can correct. Every line of it is a guess it admits to.
- 02read everything
tomograph inventoryRead everything
Postgres over the catalog; TypeScript and React over the syntax tree. Each node records the collector and the file or object it came from.
- 03look at it
tomograph serveLook at it
The canvas opens on localhost. Zoom to change detail, filter by level, toggle the seam, click anything to see where it came from.
Want to see your own app drawn this way?
It is being built against Postgres and React first, properly, rather than against everything badly. Leave an address and we will tell you when your stack is ready.